Flowcharts are powerful tools for visualizing complex processes within a team. In this article, we will explore the meaning of various flowchart symbols, when they are useful, and […]

How to Create Diagrams with ChatGPT and Markmap
Diagrams, or mind maps, serve as valuable tools for visually organizing information, enhancing comprehension when explaining content or studying. While ChatGPT can respond with tables and other code […]
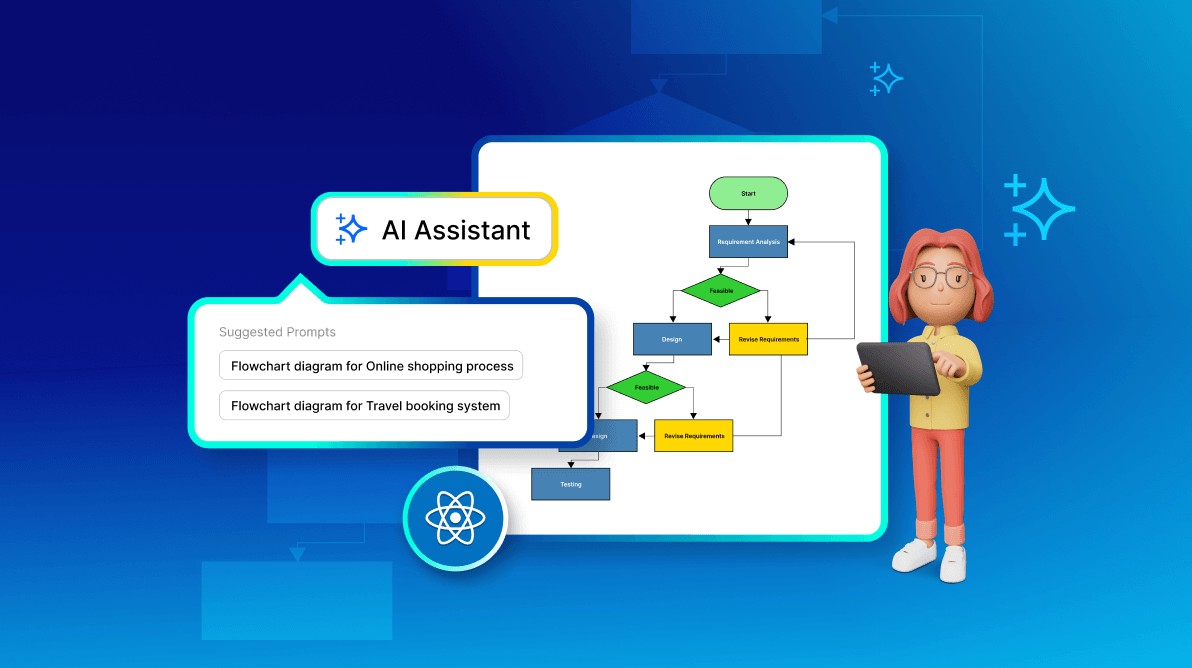
AI-Powered Flowchart Generators: A Comprehensive Guide
In an era defined by rapid technological advancement, the ability to create flowcharts quickly and efficiently is more crucial than ever. Whether for personal use, academic projects, or […]
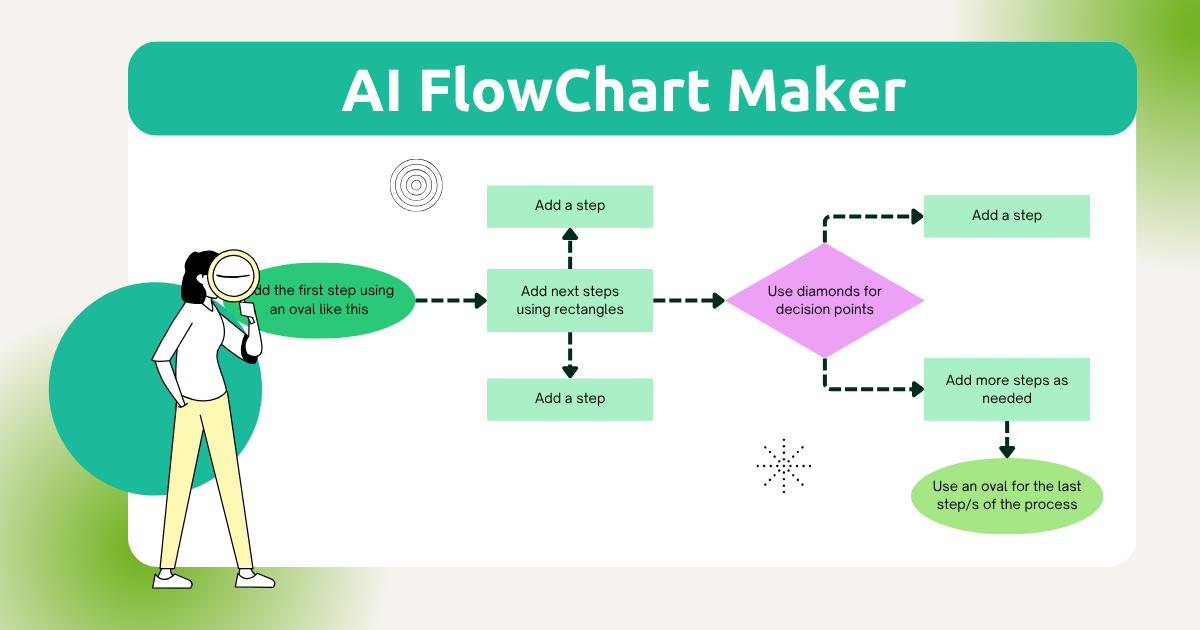
The Power of AI in Flowchart Creation: An In-Depth Guide
In an era defined by rapid technological advancement, the ability to create flowcharts quickly and efficiently is more crucial than ever. Whether for personal use, academic projects, or […]
The Rise of AI-Generated Graphs and Diagrams in Data Visualization
Data visualization is a critical aspect of data analysis and business intelligence. It allows us to understand complex datasets by representing them in a visual and easy-to-comprehend format. […]
The Top 5 AI-Powered Graph and Diagram Generators of 2024
In an era where data-driven decision-making is paramount, the ability to visualize complex datasets effectively is more critical than ever. Imagine having a tool at your fingertips that […]
Using AI to Generate Diagrams with Draw.io and Mermaid.js
In today’s digital landscape, visual representation of ideas, workflows, and processes is more crucial than ever. Diagrams not only enhance understanding but also facilitate communication among team members […]
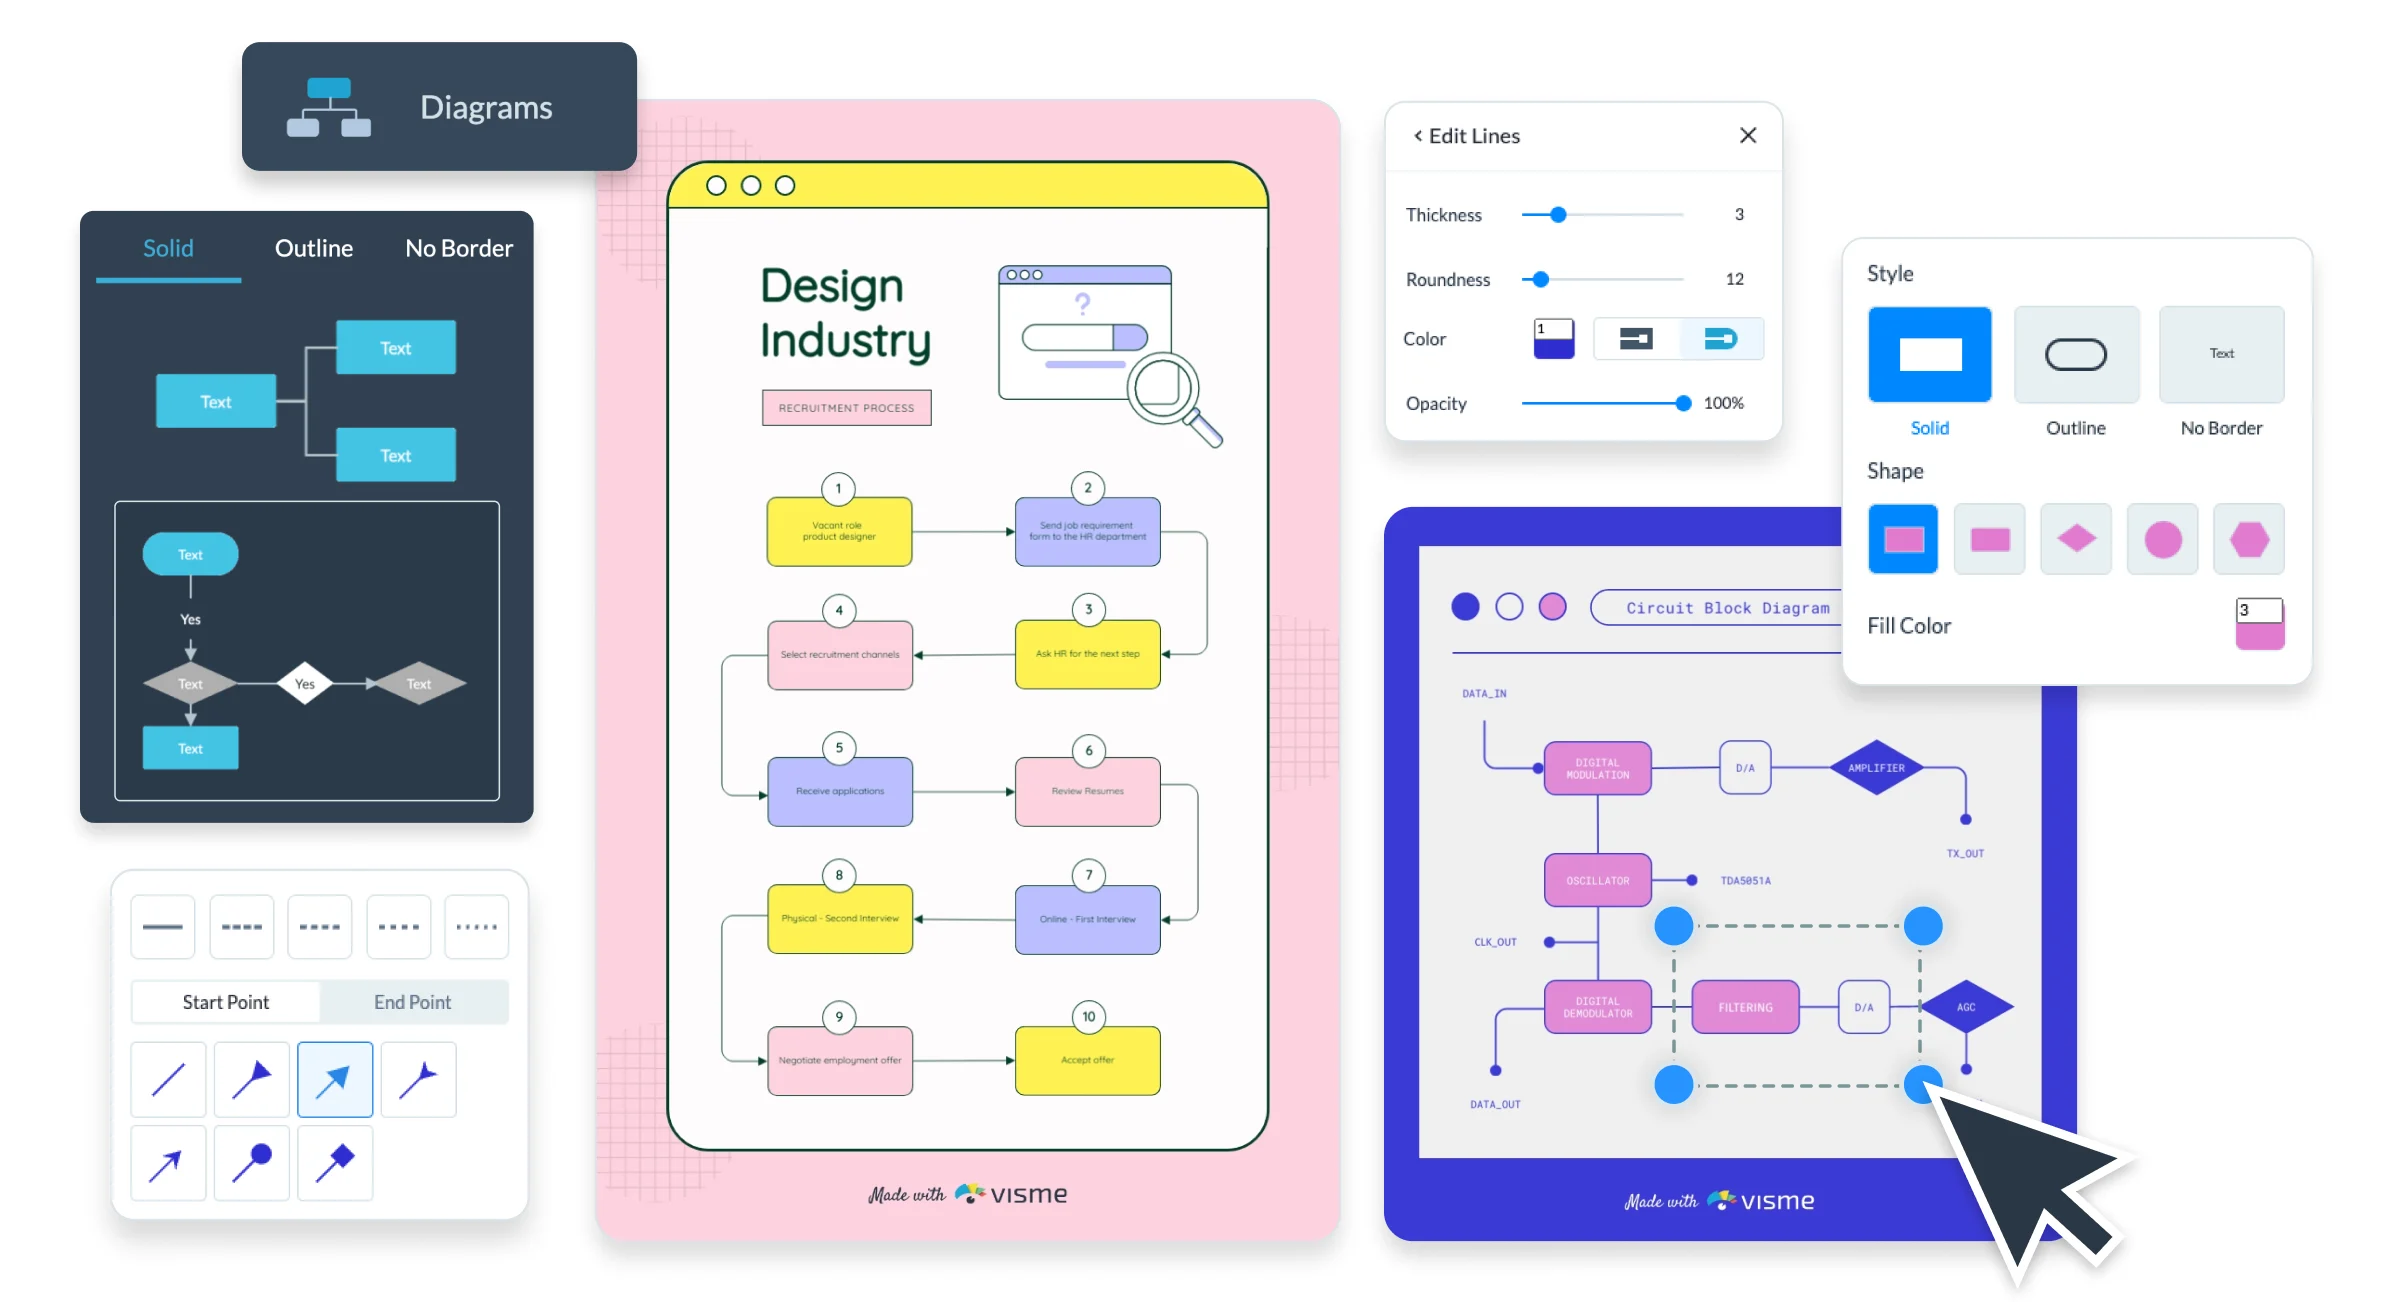
Overview of the Best Data Visualization Tools
Data visualization tools are essential for transforming complex datasets into meaningful insights through graphical representation. The market offers a diverse range of tools catering to different user needs, […]
What is Data Visualization and Why It’s Important?
What is Data Visualization? Definition: Data visualization is the graphical representation of data to uncover patterns, trends, and insights. It involves translating complex datasets into visual formats such […]
How does UX/UI design affect the ROI of your digital product?
User Experience (UX) and User Interface (UI) design play pivotal roles in influencing the Return on Investment (ROI) of digital products. The effectiveness of these design aspects can […]
What Should You Look For in Data Visualization Tools?
Selecting the right data visualization tool is crucial for effectively analyzing and communicating insights from your data. Here are key factors to consider when evaluating data visualization tools: […]
Best Practices for Designing Dashboards
Designing effective dashboards requires careful consideration of both visual and functional aspects to ensure that users can quickly and easily derive insights from the presented data. Here are […]